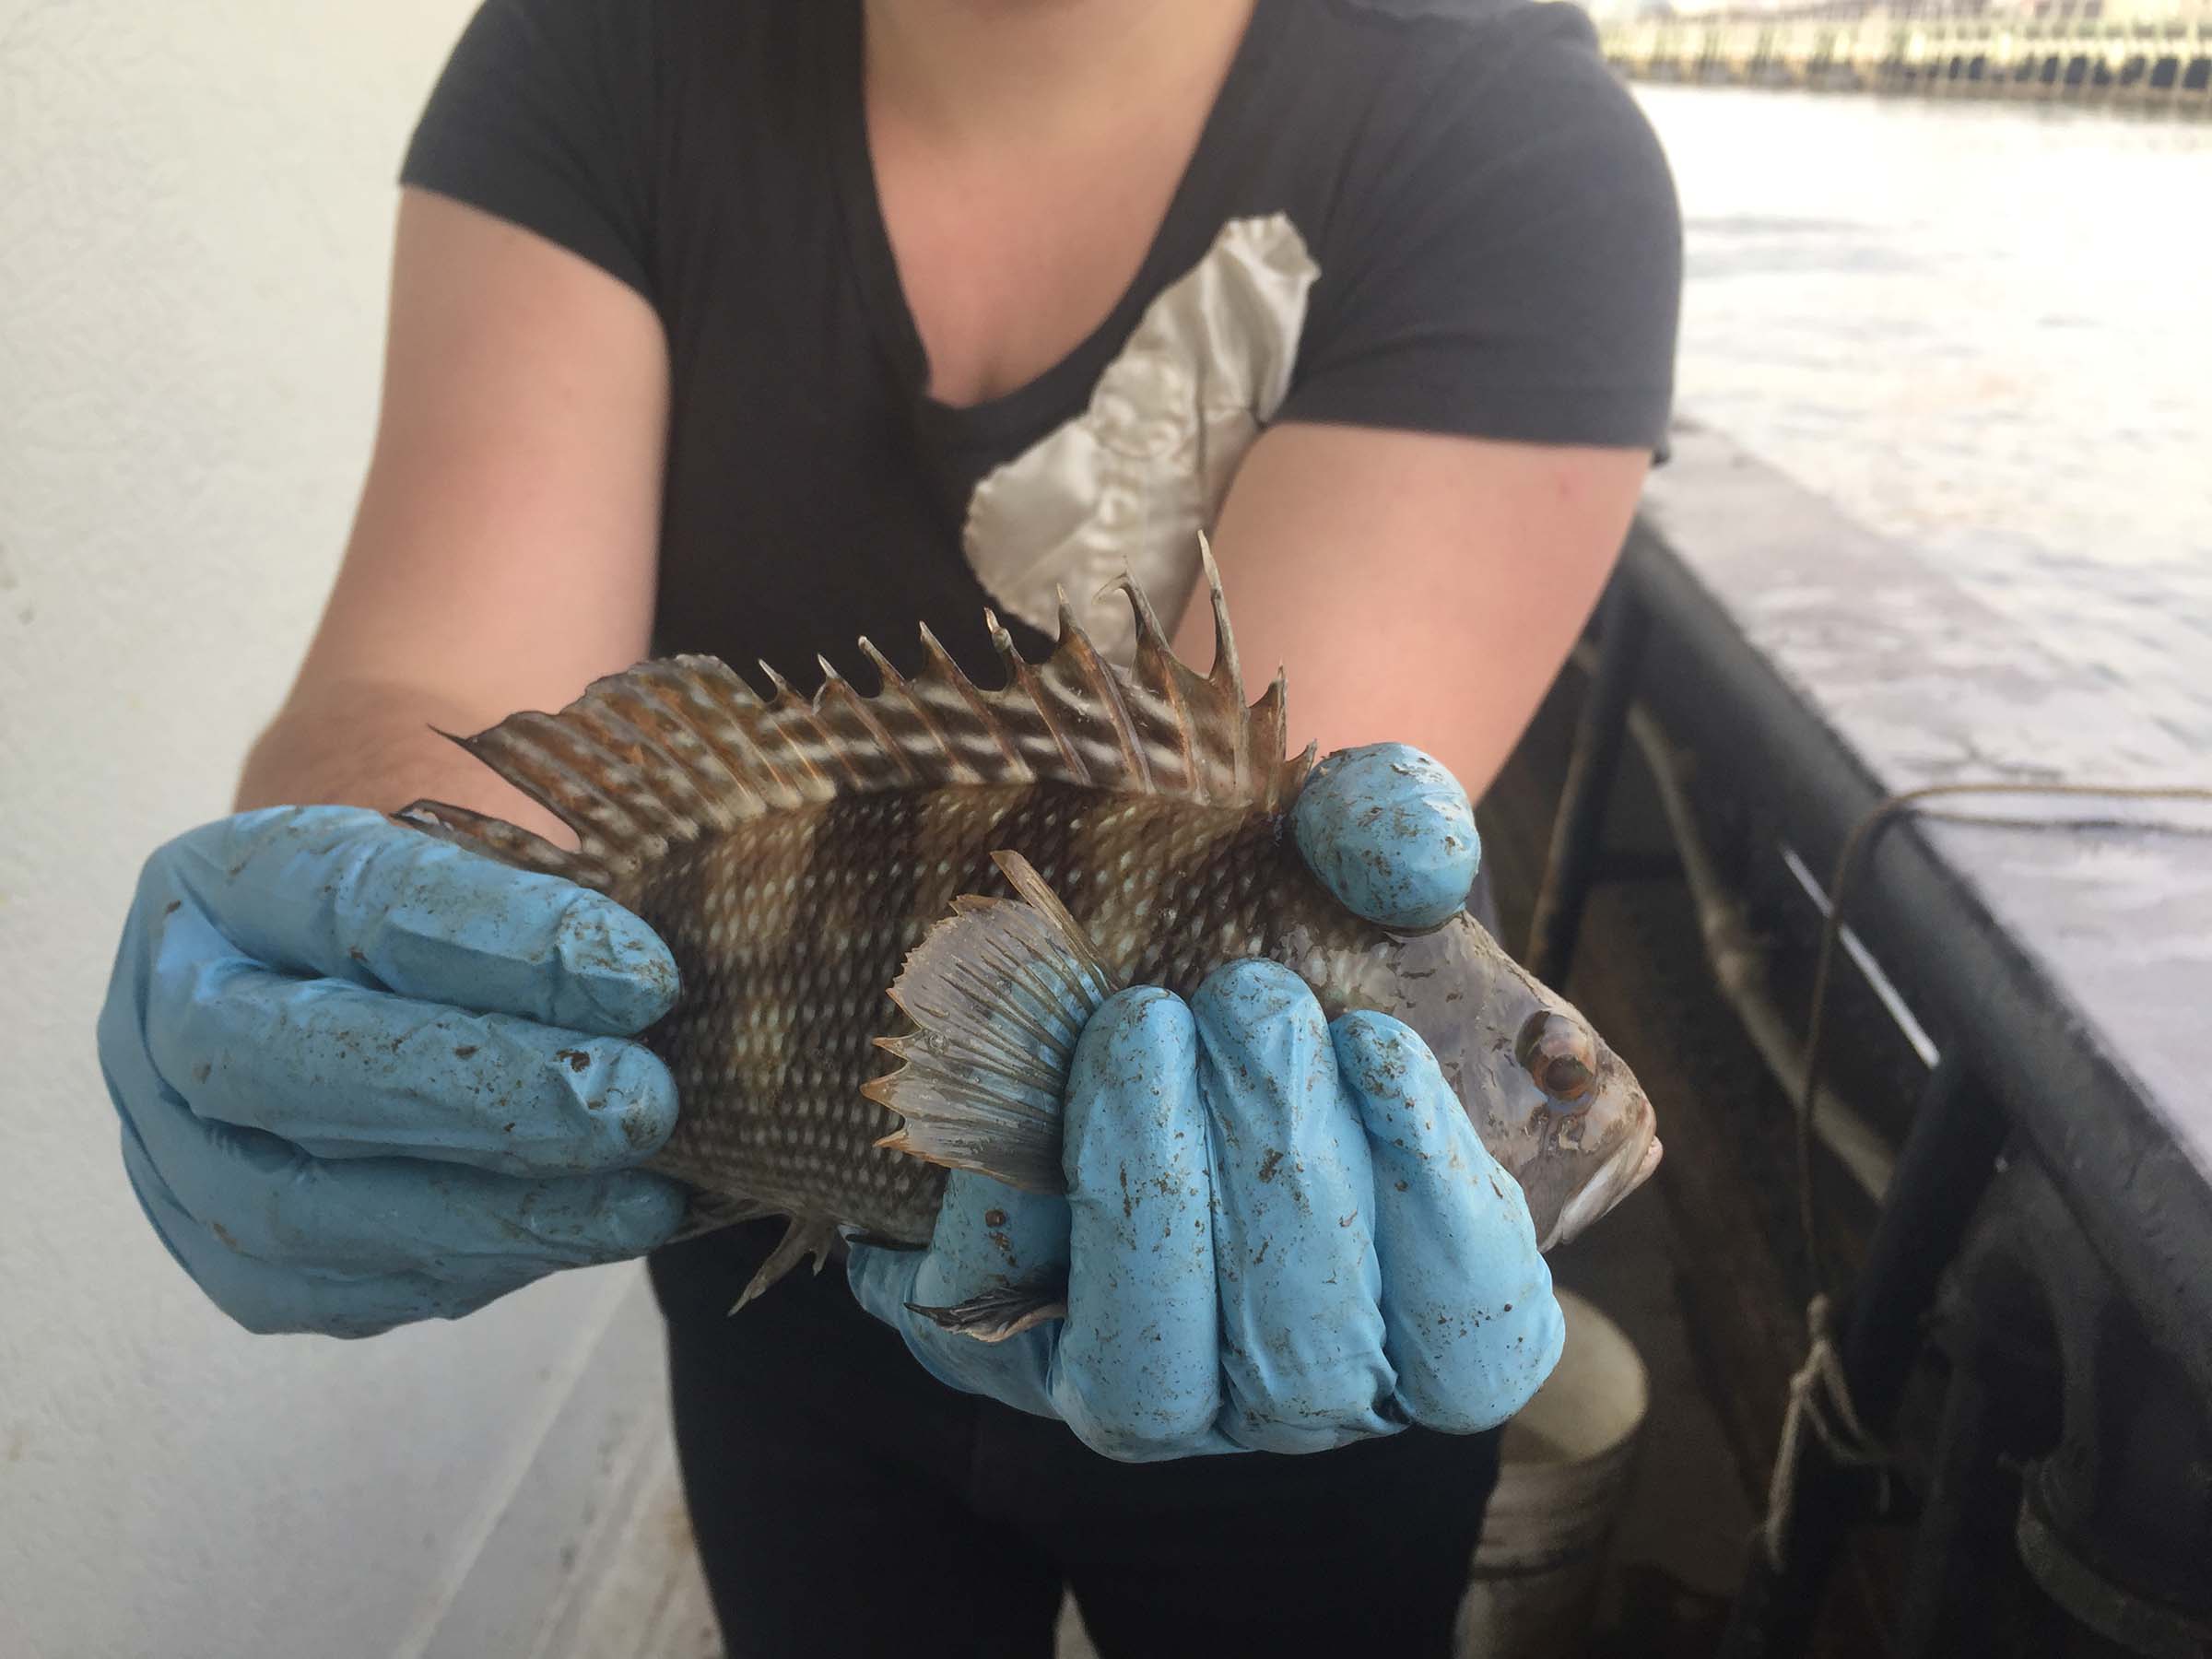
Graphing Fish Ecology Data: Extended Edition
 Now that we’re familiar with our fish ecology survey, it is time for you to take on the role of a Hudson River Park scientist once again! HRPK scientists collect a lot of fish as they conduct the survey and there is a lot of information to communicate. It can be challenging to understand what is going on when looking at raw data so scientists build graphs to effectively communicate their findings to other scientists and the public. For an introduction into graphing fish ecology data, please check out our Graphing Fish Ecology Data 101 lesson.
Themes: Hudson River Ecology; Native Species; Field Science; Species Sampling
Ages: 10+
Prep Time: 5 min
Activity Time: 20-30 min
Resources: Fish in Hudson River Park Poster